
Interviewer: If I ask about high availability, how would Your Excellency respond?
1. Introduction
1.1 Reservoir flooding
Shenzhen had just sent away Typhoon Sura and welcomed Anemone.
On the same day, schools in Shenzhen once again announced the closure of classes.
A student feedback: in shenzhen school is too “tough”, the opening week of school, closed twice.
Workers inside OS: you guys just steal the joy, after all, as long as the traffic does not stop, we are not going to stop working.
Shenzhen Transportation: The reservoir is full, what’s the matter with my transportation? After all, our high availability design is not a cover.
1.2 Availability of Shenzhen transportation system
If the Shenzhen traffic as an application system, from the point of view of software development, flooding is an unexpected attack, the Shenzhen reservoir flooding event is actually ** to maintain the stability of the system to carry out bulk data deletion **.
Although the instantaneous data is very large, resulting in a short period of unavailability of Shenzhen’s transportation system. However, through the operation of the drainage system, temporary diversion and other measures, Shenzhen transportation, a system that serves more than 10 million users, quickly operated again.
I have to say, that’s pretty strong!
Interview Review
What does software usability have in common with transportation usability?
The thought spreads infinitely, reminding me of an interview question from the second interview of Tencent a long time ago.
Interviewer: we know that distributed systems have three high, high performance, high concurrency and high availability. ** taking into account the performance and concurrency of the system, from what aspects will you consider to design a highly available system **?
Combined with the handling of Shenzhen traffic, I will introduce the basic concepts of high availability, performance estimation, system testing, and flow-limiting means respectively.
2. High Availability Design
2.1 What is High Availability
High Availability (HA) of a software system is one of the factors that must be considered in the architectural design of a distributed system, and it is usually measured by the time that a system provides a service.
If we take Shenzhen traffic as a system, assuming that the traffic can always run, the availability of the system is 100%.
Of course, as with rainstorms and floods, the system can suffer from sudden traffic surges, or hacker attacks, so 100% availability of the system is hard to guarantee.
For every 100 units of time the system is running, there will be 1 unit of time when the service is not available, the availability of the system is 99%.
Large software systems, such as Taobao, WeChat, etc., pursue a high availability goal of 99.9999%, commonly known as 6 9, i.e., no more than 31.5 seconds of downtime throughout the year.
2.2 Performance Metrics
When we design a system, we need to do a measurement of the system load capacity, i.e. Performance Estimation, and then target the high availability design.
When doing performance estimation, we have to understand a few metrics first.
Response Time
Response time refers to the time it takes for a client to receive the response data from the time it sends out a request, which is the most important performance indicator of the system, directly reflecting the speed of the system to process the request.
Why is the response time is the most important indicator, we take the Shenzhen transportation chestnut, the response time is in the queue time passengers need to wait for a taxi, or in the subway station queuing for the subway time.
The length of the response time is a direct reflection of whether the transportation transit status is normal.
Concurrency Count
Concurrency count is the number of requests the system handles at the same time, reflecting the load pressure of the system. When we do performance testing, we usually use multiple threads to simulate the number of concurrent users, each thread acts as a user request, and the number of threads is the number of concurrency obtained in the performance metrics.
The concurrency number of a transportation system can be understood as the sum of the number of passengers in all transportation.
Throughput
Throughput is the number of requests processed by the system per unit of time, which reflects the size of the system’s ability to handle the business. It is generally measured in terms of HPS (Requests Per Second, Hits Per Second), QPS (Queries Per Second, Qeries Per Second) and TPS (Transactions Per Second, Transactions Per Second).
During the normal operation phase of a system, the relationship between these three metrics is: Throughput = Number of Concurrencies / Response Time.
Throughput in a transportation system reflects whether the traffic is flowing smoothly and how much capacity the system is carrying.
2.3 System Testing
After familiarizing ourselves with the performance indicators of the system, we can start to do system testing. The specific process is as follows: ** Continuously increase the concurrency of the system, so as to test out the system’s ability to resist pressure, as well as the system’s performance threshold **.
System testing is divided into three phases, including performance testing, load testing and stress testing.
Performance Testing
In the early stage of system design, we will first plan an expected target for performance. During the testing period, continuously apply pressure on the system to verify whether the system achieves the expected performance target within the acceptable range of resources.
Take Shenzhen transportation as an example, we design a subway system at the initial stage, through research and estimation, etc., based on the size of the daily flow of people to design the subway system.
Performance testing can be interpreted as increasing the number of passengers under a computer model to estimate whether the subway system can achieve the expected transportation capacity.
Load Testing
Constantly applying concurrent requests to a system, increasing the stress on the system until one or more of the system’s metrics reaches a safety threshold.
The same is true for transportation systems, if there are too many objects (people or cars) involved in the traffic, the overall transportation capacity will be affected! That’s why all the first-tier cities limit the number of cars on the road.
Stress test
Exceeding the safe load, increasing the number of concurrent requests and continuing to stress the system until the system crashes or no more requests are processed, at which point the number of concurrent requests is the system’s maximum stress tolerance.
Stress test is to measure the maximum capacity of the system bottleneck, take the traffic system as an example, if the number of passengers in a moment to reach the maximum capacity value, Shenzhen traffic will immediately paralyze.
PS:The maximum pressure capability is a theoretical value that may not be reached in practice, but must be estimated during system design.
3. “Flow Limiting” for Highly Available Designs
3.1 Flow limiting
Limit flow in the early stage of system design generally do not need to consider, and when the number of users increases, ** when the system’s processing capacity can not cope with the external sudden increase in traffic access, in order to let the system to maintain stability, must be taken to limit the flow of measures **.
Inside the transportation system, the most common flow restriction is the foreign vehicle restriction.
For example, in Shenzhen, foreign cars are only allowed to travel on specified dates (weekends or holidays), or are not allowed to travel during specified peak hours (weekdays from 7am to 9am, and from 5:30pm to 7:30pm), all of which belong to the flow restriction to maintain the normal operation of the transportation system.
1) Traffic Restriction Indicators
TPS
Transactions Per Second, The number of transactions completed per second. This is the most reasonable value to limit the flow, but it is not very practical, because in distributed business systems, transactions often need more than one module to complete.
To limit the flow according to TPS, the time granularity may be very large, and it is difficult to accurately assess the response performance of the system.
In the transportation system, if we take the passengers from Huaqiangbei in Futian District to Kexingyuan in Nanshan District as a transaction, then limiting the number of passengers from Huaqiangbei to Nanshan District is obviously not possible.
the number of passengers is obviously unlikely. Because in this process, passengers may pass through the subway, buses and other means of transportation, i.e., a transaction requires the cooperation of multiple modules to complete.
HPS
Hits Per Second, Hits Per Second. If each transaction completes one request, then TPS and HPS are equivalent. However, in a distributed scenario, multiple requests may be required to complete a transaction, so TPS and HPS are not equivalent.
Like the example in TPS, if a passenger needs only one direct bus ride from Huaqiangbei to Kexingyuan, then only one transportation participation (one request) is needed to complete the transaction.
QPS
Query Per Second, the number of client queries that can be responded to per second, is also an important measure of overall server performance.
Inside the transportation system, QPS can be understood as the sum of the number of passengers accommodated. Currently, most mainstream traffic limiting methods use HPS as a traffic limiting index.
2) Flow limiting methods
1. Traffic counter
The simplest and most direct way to limit the flow, for example, limiting the maximum number of requests to 100 within 5 seconds, ** access will be denied if the number exceeds this number**. Traffic counting in a transportation system limits the number of vehicles allowed to pass within a certain period of time.
There are two obvious problems with this method of limiting traffic.
centralized access
It is difficult to control the unit time, and it is easy to have centralized access. For example, the following scenario occurs:
In the first 4 seconds, there is only one access, in the 5th second, there are 99 accesses; in the 6th second, there are 99 accesses, and in the next 4 seconds, there is only 1 access. Globally, the 200 requests in 10 seconds is not exceeded, but the graph shows that this traffic situation is definitely an anomaly.
Unnecessary Traffic Limiting
There is a period of time when the traffic is exceeded, but it is not always really necessary to limit the traffic. For example, the following scenario:
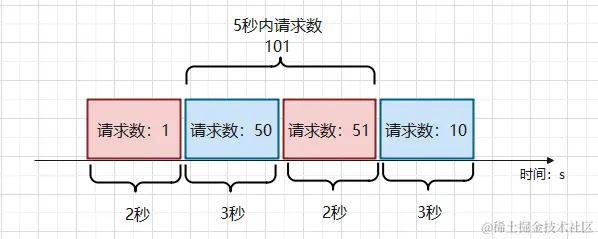
If the two middle blocks of accesses happen to be in a 5-second cycle, then the traffic is exceeding the limit. In this case, the next 10 requests may be dropped, which doesn’t make sense.
2. Sliding Time Window
Sliding time window is a popular algorithm for limiting traffic, the main idea is to consider time as a forward scrolling window, as shown in the following figure:
It is characterized by the fact that ** time is processed in slices, and the sliding window counts the number of requests in a total time period each time. At the next time period, the previous time slice is discarded and the number of requests from the following time slice is added ** It solves the problems that can occur with traffic counters.
Its disadvantage is that it does not have a fine enough control over the traffic to limit the traffic concentrated in a short period of time and once the limit is reached, the requests are all violently rejected directly.
Inside the transportation system this may result in the loss of a portion of the passing traffic, which is not very friendly to the user experience.
3. Leaky Bucket Algorithm
The idea of leaky bucket algorithm is shown below:
A leaky bucket is a fixed-size queue that caches the requests sent by the client and then sends them evenly to the server.
If the client request rate is too fast and the queue of the leaky bucket is full, it will either reject it directly or go downgrade the processing logic without impacting the server side.
The advantage of the leaky bucket algorithm is that it is simple to implement and can use message queues to shave peaks and fill valleys. But it also has several problems:
- Leaky Bucket size is not easy to control, too large will bring more pressure to the server, too small may lead to a large number of requests are discarded;
- The rate of requests given to the server by the leaky bucket is difficult to control;
- The use of cached requests will make the response time of the request longer.
4. Token Bucket Algorithm
Token bucket algorithm and go to the hospital registration is almost the same logic, see the doctor before you need to register, and the hospital every day to put the number is limited:
Token bucket algorithm in the token is the same, the client before sending a request, need to first get the token from the token bucket. If it fetches it, it sends the request; if it fails to fetch the token, it can only be rejected and needs to wait.
The token bucket algorithm solves the three problems of the leaky bucket algorithm (the rate is difficult to control, the size of the leaky bucket is difficult to control and the problem of the request cycle becomes longer), and the implementation is not complex, the use of semaphores can be realized. In the actual flow limiting scenarios used in the most, such as Google and Guava in the use of token buckets to limit the flow.
Inside the transportation system, the license plate shaking is the token bucket flow limiting idea. Therefore, ** software systems serve life, software design also comes from life **.
5. How to limit flow in distributed scenarios
In distributed scenarios, can the above flow limiting scheme still be applied? Take a chestnut:
If we put the token into a separate middleware (e.g., Redis) for the whole distributed system, then the client needs to interact with the token bucket when invoking the combined service, and the combined service invokes the order, inventory, and account services, and the number of interactions obviously increases a lot.
One improvement is that the client first obtains four tokens before invoking the service, ** subtracts one token when invoking the combination service and passes three tokens to the combination service, and consumes one token when invoking the sub-services ** respectively.
In the transportation system, the distributed token bucket design is equivalent to a single transportation that needs to cross multiple hurdles, each of which requires a traffic limit token as a way to maintain the stability of the whole system.
4. Summary
For flow limiting, it is important to choose a suitable flow limiting algorithm. Token bucket algorithms have more obvious advantages, and they are also the flow limiting algorithms used in many large-scale projects.
When designing the system, these patterns need to be matched with the evaluation of business volume and performance test data for threshold modification, and these thresholds are best saved in a hot-updatable configuration center for real-time modification.
Interviewer: hmmm, good, besides flow limiting, are there any other methods that can be used in system design to maintain high availability?
** Flow limiting, fusing and service degradation are all important design approaches for high system availability**.
Fusing, the equivalent of putting a fuse between requests and services. When the service can’t carry the constant access pressure, the fuse breaks, preventing the server from crashing if it can’t carry the pressure.
Compared to flow limiting and fusing, service degradation is considered from a global system perspective. After a service fuses, it will generally let the request go through the processing method that implements the configuration, and this processing method is a degradation logic.
Interviewer: ok, interview time is almost up, let’s not expand on this for now, let’s do an algorithmic question ……
Due to the limited space, in this issue we only introduced the indicators and methods related to flow limiting.